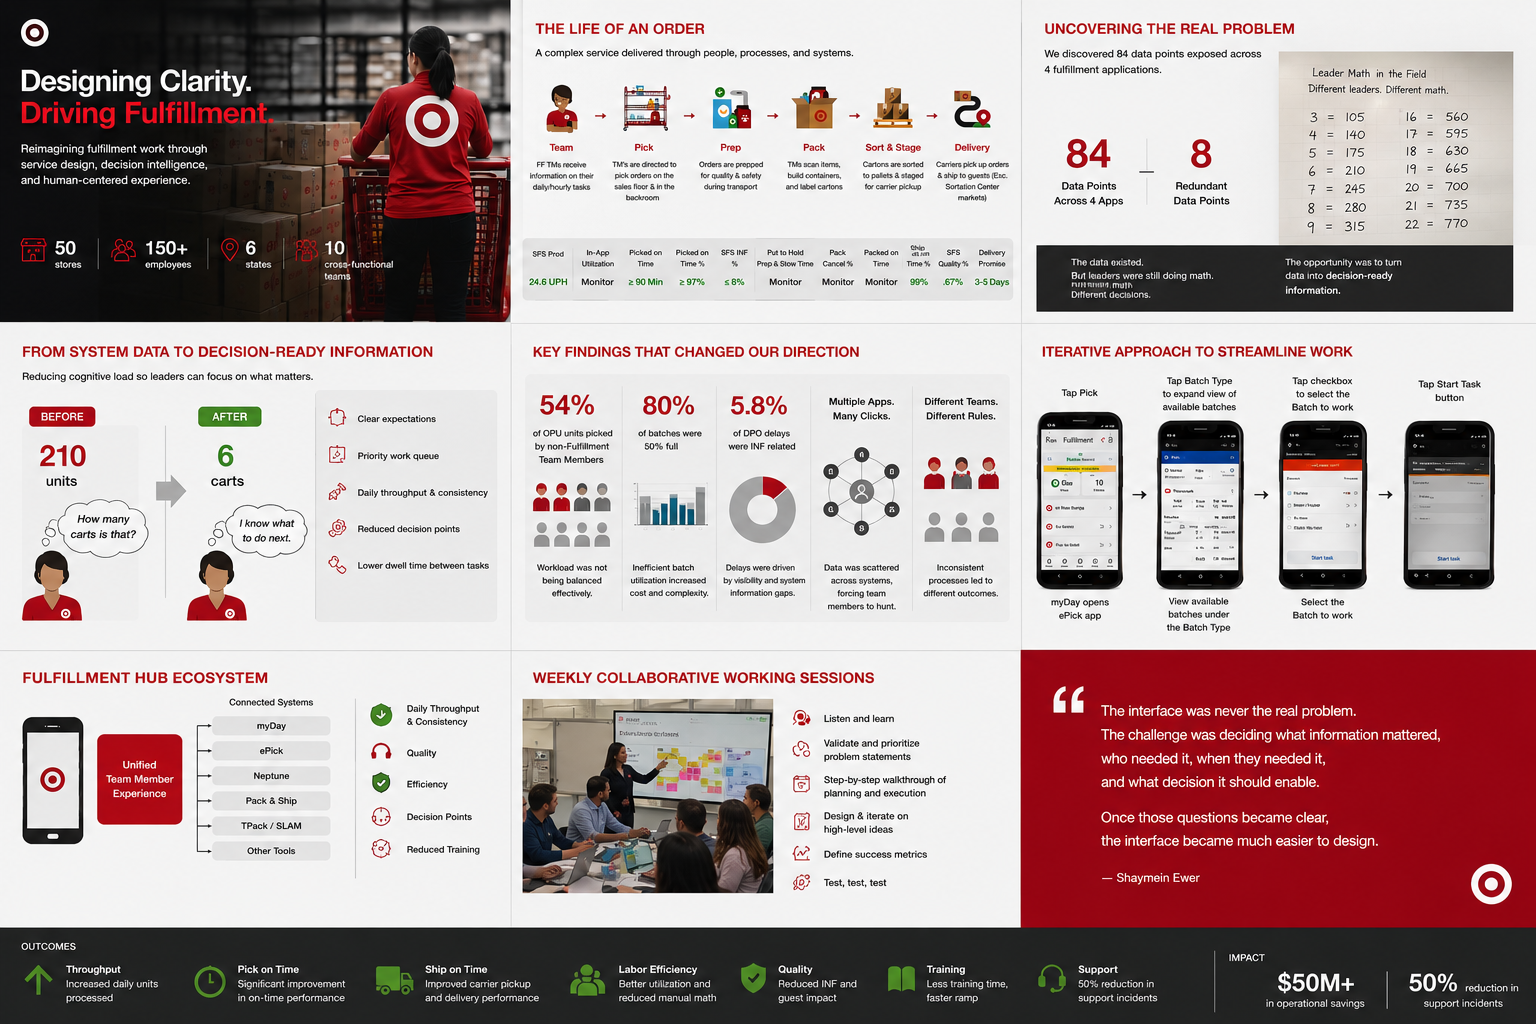
Turning a request to “save steps” into a strategy for rethinking how fulfillment work gets done
Role
Lead Service Designer & User Experience Designer
Scope
Service Design · UX Strategy · Field Research · Information Architecture · Journey Mapping · Ecosystem Mapping · Data Strategy · Workshop Facilitation · Product Design · Governance
Scale
50 stores · 6 states · 150+ employees · 10 cross-functional teams · 1,800+ stores using fulfillment tools
The Challenge
It started with a simple request: save steps.
Target leadership asked us to find ways to reduce the number of steps team members took while completing fulfillment work.
On the surface, this appeared to be a workflow optimization problem.
But fulfillment is not a single workflow.
A digital order moves through a complex service ecosystem involving forecasting, staffing, picking, preparation, packing, staging, pickup, shipping, inventory, data, applications, store operations and dozens of decisions made by team members and leaders throughout the day.
Removing a tap or shortening a workflow might save seconds.
I wanted to understand what was costing us minutes—or hours.
So I expanded the question.
What if the problem wasn’t the number of steps?
What if the larger opportunity was reducing the number of decisions employees had to make to complete those steps?
My Role
I led the service-design and user-experience effort across the fulfillment ecosystem.
My responsibility extended beyond designing an application. I coordinated research, product strategy, operational thinking and cross-functional collaboration across approximately 10 teams.
I conducted field research, store visits and interviews; created journey and ecosystem maps; analyzed information architecture; partnered with data scientists; designed and facilitated workshops; created myDay experiences; established governance and working cadences; and translated the findings into a strategy that Product and Engineering could act upon.
A significant part of my role was simply getting people to see the same problem.
Individual teams understood their products.
Store Operations understood the work.
Engineers understood their systems.
Data teams understood their information.
But very few people could see how all of those pieces affected one another.
My job was to make the whole service visible.
Go Where the Work Happens
You cannot understand fulfillment entirely from a conference room.
I visited approximately 50 Target stores across six states, spoke with and observed more than 150 employees, and spent hundreds of hours studying fulfillment work in its actual environment.
I followed orders through the system.
I observed leaders planning workload.
I watched team members pick merchandise, prepare orders, pack shipments, stage orders and deliver them to guests.
During holiday peak periods, I worked alongside fulfillment teams myself.
This mattered.
The application showed us how the system was supposed to work.
The store showed us how people actually made it work.
Mapping the Life of an Order
One of the first things I needed to establish was a shared view of the service.
A single digital order could move through:
Order → Staffing → Pick → Prep → Pack → Sort & Stage → Hold → Pickup / Drive Up → Delivery
Underneath that seemingly simple journey was an ecosystem of applications, business rules, data sources, operational processes and teams.
I mapped those relationships to understand three things:
Where does information originate?
Where are decisions being made?
Where are we asking humans to compensate for limitations in the system?
That changed the conversation.
Instead of asking:
How can we make this screen faster?
we could ask:
Why does this decision exist in the first place?
The Real Problem Wasn’t a Lack of Data
It was turning data into decisions.
Target had enormous amounts of operational data.
But more data did not necessarily make work easier.
Working with newly established data scientists, I helped develop the questions we needed to ask of the data and began inventorying the information available throughout the fulfillment ecosystem.
Across four fulfillment applications, we identified approximately 84 different data points, including redundant information appearing in different forms.
That raised a more important question:
How much of this information actually helps someone make a decision?
Some information described the system.
Some measured performance.
Some served as an input into another calculation.
And some was directly actionable.
Yet employees often had to determine that distinction themselves.
The opportunity wasn’t simply to expose more information.
It was to determine:
What information matters?
Who needs it?
When do they need it?
What decision should it enable?
A Whiteboard Changed the Direction
One of the most revealing discoveries didn’t come from an analytics dashboard.
It came from the field.
Store leaders were doing their own workload calculations.
They had developed formulas for translating units into carts, carts into workload and workload into staffing requirements.
Different leaders sometimes performed those calculations differently.
The organization possessed the data.
The applications displayed the data.
But employees were still creating their own decision-support systems.
That represented both cognitive load and operational variability.
If two leaders interpret the same information differently, they can make two different staffing decisions.
Multiply that across hundreds of decisions and nearly two thousand stores and a UX problem becomes a business problem.
From System Data to Decision-Ready Information
This became one of the core principles of the work:
Don’t simply show people data. Help them understand what the data means.
Consider a fulfillment leader seeing:
210 units
That number is technically accurate.
But it still requires interpretation.
The leader may need to remember a conversion formula, calculate how many carts that represents, understand the current workforce and then determine whether staffing needs to change.
Instead, the experience could translate the underlying information into something closer to:
6 carts
and ultimately:
1 additional team member needed.
Same underlying system.
Very different cognitive burden.
We began moving from system-oriented information toward decision-ready information.
The goal wasn’t to eliminate human judgment.
It was to eliminate unnecessary variables so employees could focus their judgment where it actually mattered.
Designing for Cognitive Load
Target stores contain employees with dramatically different levels of experience.
A fulfillment experience therefore cannot depend on years of institutional knowledge.
The system needed to help a new team member make a good decision without preventing an experienced leader from exercising expertise.
That meant designing for:
clarity instead of interpretation
consistency instead of tribal knowledge
priorities instead of information overload
action instead of calculation
confidence instead of guesswork
Reducing cognitive load also had a business consequence.
When work becomes easier to understand, training becomes easier, execution becomes more consistent and errors become less dependent on individual experience.
Information Architecture Became Service Architecture
The information architecture work extended well beyond reorganizing screens.
We examined:
- what information should exist;
- where that information originated;
- who needed access to it;
- when it became relevant;
- where information was duplicated;
- how different systems interpreted the same information;
- what information should be actionable;
- and which decisions could potentially disappear altogether.
This meant UX decisions increasingly affected data requirements, APIs, product architecture and operational processes.
The interface was becoming the visible layer of a much larger service architecture.
Getting Ten Teams to Solve One Problem
Technology wasn’t the only source of fragmentation.
The organization was fragmented too.
Approximately 10 teams contributed to different parts of fulfillment.
Each team had its own product, priorities, roadmap, terminology and responsibilities.
Everyone could be successfully optimizing their individual piece while collectively creating a fragmented service.
I introduced service-design methods that allowed those teams to examine fulfillment together.
Through workshops, collaborative mapping and recurring working sessions, we established shared:
problem statements
desirable outcomes
service maps
dependencies
success measures
priorities
and ultimately a common language for discussing fulfillment.
Instead of asking:
What should my product do?
teams could begin asking:
What does the fulfillment service need to do—and what role does my product play in making that happen?
That distinction was fundamental.
Creating a New Working Model
Alignment could not depend on a single workshop.
I established a cross-functional governance and communication cadence to keep teams working against shared problems.
Bi-weekly capability sessions allowed teams to compare problem statements, identify upstream and downstream dependencies, define desirable outcomes and surface opportunities for partnership.
Research findings could move between Operations, Product, Design, Engineering and Data instead of remaining inside individual teams.
The service model became a common reference point.
It allowed people working at the micro level to understand the macro system—and allowed leadership looking at the macro system to understand where specific product decisions affected it.
The Fulfillment Hub
The research ultimately pointed toward a larger strategic direction.
Team members should not need to understand Target’s technical architecture in order to perform their jobs.
Behind the scenes, fulfillment might require many applications, services and systems.
To the employee, however, it should feel like one coherent service.
That became the vision for the Fulfillment Hub.
Rather than attempting to replace every backend application, the strategy established a unified employee experience supported by interconnected systems underneath it.
The Hub would create a consistent layer between:
Store Operations
Team Member Tools
and
Supporting Architecture
while providing flexibility for future fulfillment capabilities.
Development of the backend strategy had begun before I left Target, creating the foundation for a more dynamic architecture.
Bringing the Strategy Into myDay
The strategy also translated into tangible product experiences.
The myDay fulfillment experience began bringing critical fulfillment information into a more coherent workspace.
We designed experiences around questions employees were actually asking:
What work needs attention?
What should I do next?
Are we on pace?
Where should I assign people?
What is at risk?
When does this work need to be completed?
Instead of requiring employees to navigate the organization of Target’s systems, the experience increasingly organized itself around the work employees were trying to accomplish.
Concepts that shipped included:
- myDay Fulfillment;
- Pickup experiences;
- Ship experiences;
- team-member workload visibility;
- prioritized work queues;
- deep linking into ePick;
- staffing recommendations;
- and clearer Pick, Prep and Pack workflows.
The experience became the visible expression of the service strategy.
Designing for Business Outcomes
We did not define success by whether employees liked a screen.
We connected experience decisions to operational outcomes.
Our hypotheses targeted improvements including:
↑ Pick on Time
↑ Ship on Time
↑ Daily throughput
↑ Fulfillment labor utilization
↓ Decision points
↓ Dwell time between tasks
↓ Training burden
↓ Operational inconsistency
The fulfillment solutions and subsequent work were ultimately used daily across 1,800+ Target stores.
The broader body of fulfillment work contributed to more than $50 million in operational savings and a 50% reduction in support incidents.
Those numbers mattered.
But they represented something larger.
We had demonstrated that experience design could influence operational performance—not simply interface usability.
The Most Important Outcome Wasn’t a Screen
I changed the way Target approached the problem.
Instead of treating fulfillment as a collection of individual applications, we began examining it as an interconnected service.
Instead of allowing individual teams to solve isolated problems, we created mechanisms for teams to understand how their decisions affected the entire ecosystem.
Instead of treating UX as the visual layer at the end of product development, we used design to frame the problem itself.
I introduced service-design thinking that helped Target move continuously between the macro and micro:
from enterprise strategy,
to operational processes,
to systems and data,
to employee decisions,
to individual interactions.
The interface was an outcome of that thinking—not the starting point.
What I Learned
Complex organizations rarely suffer from a shortage of information.
They suffer from a shortage of clarity.
The fulfillment ecosystem contained people who understood stores, people who understood products, people who understood technology and people who understood data.
The breakthrough came from creating a way for them to understand one another.
That is where I believe service design creates its greatest value.
It makes complexity visible.
It creates a common language.
It turns ambiguity into something people can act upon.
And when people can finally see the same problem, they can begin solving it together.